🍔 900M Food Insecure. 270Mt Waste. Global Migrant Labor.
Chart of the Day #55 looks at Migrant Workers, Waste Generation and Food Insecurity.
Sabaidee 🏞️
UN agencies reported that 62M tons of e-waste was generated in 2022. The agency warned that waste from electronics is piling up globally while recycling rates remain persistently low and are expected to decline. Despite significant progress towards India's goal of eliminating chronic hunger by 2030, nutrition experts report that 74% of Indians still have insufficient access to adequate nutrition.
Today's Topics
- 🛬 Migrant Workers. Migrants 41% of the Arab States' workforce
- 🚮 Waste Generation. 270M tons of solid waste generation
- 🧑⚕️ Food Insecurity. 900M struggle with food insecurity
For unlimited access to over one million charts, request a demo.
🛬 Migrants 41% of Arab States' Workforce

Globally, migrant workers comprise 4.9% of the labor force in destination countries, with the Arab States exhibiting the highest proportion at 41.4%, likely as a result of skill shortages in their native population. Although migrants in Arab states are employed across various sectors, the majority are concentrated in blue-collar roles such as construction and domestic work. Despite this high proportion, North America and Europe host the largest migrant worker populations in absolute terms, totaling 78.3M compared to 24.1M in the Arab States.
According to the ILO, although male migrant workers are distributed evenly across the regions, only 6% of the women migrant workforce was stationed in the Arab States. Limited job opportunities beyond the care economy (including domestic work), coupled with a significant wage gap where women earn only 12.5% of men's total earnings, likely contribute to this disparity.
🚮 270M Tons of Solid Waste Generation

Municipal solid waste (MSW) generation increased by 10% between 2000 and 2017 in the US, reaching approximately 270 Mt. While paper and cardboard were the largest contributors to MSW, their share dropped nearly 24% from 2000 to 2017. The rise in digitalization has reduced the use of paper and cardboard, which could have played a part.
Food waste is the second-largest source at around 40Mt, followed by plastics and yard trimmings at 35Mt each. Textile waste also witnessed significant growth, increasing by 78% from 2000 to 2017. Although recycling has seen improvements during this period, increasing rates of consumption have likely led to higher waste. Additionally, not all materials can be effectively recycled, leaving a significant portion destined for landfills. A trend towards shorter product lifespans (planned obsolescence), particularly for electronics, and rapid release of newer models incentivize frequent replacements, fuelling the upward trend in waste generated.
🍔 900M Struggle With Food Insecurity

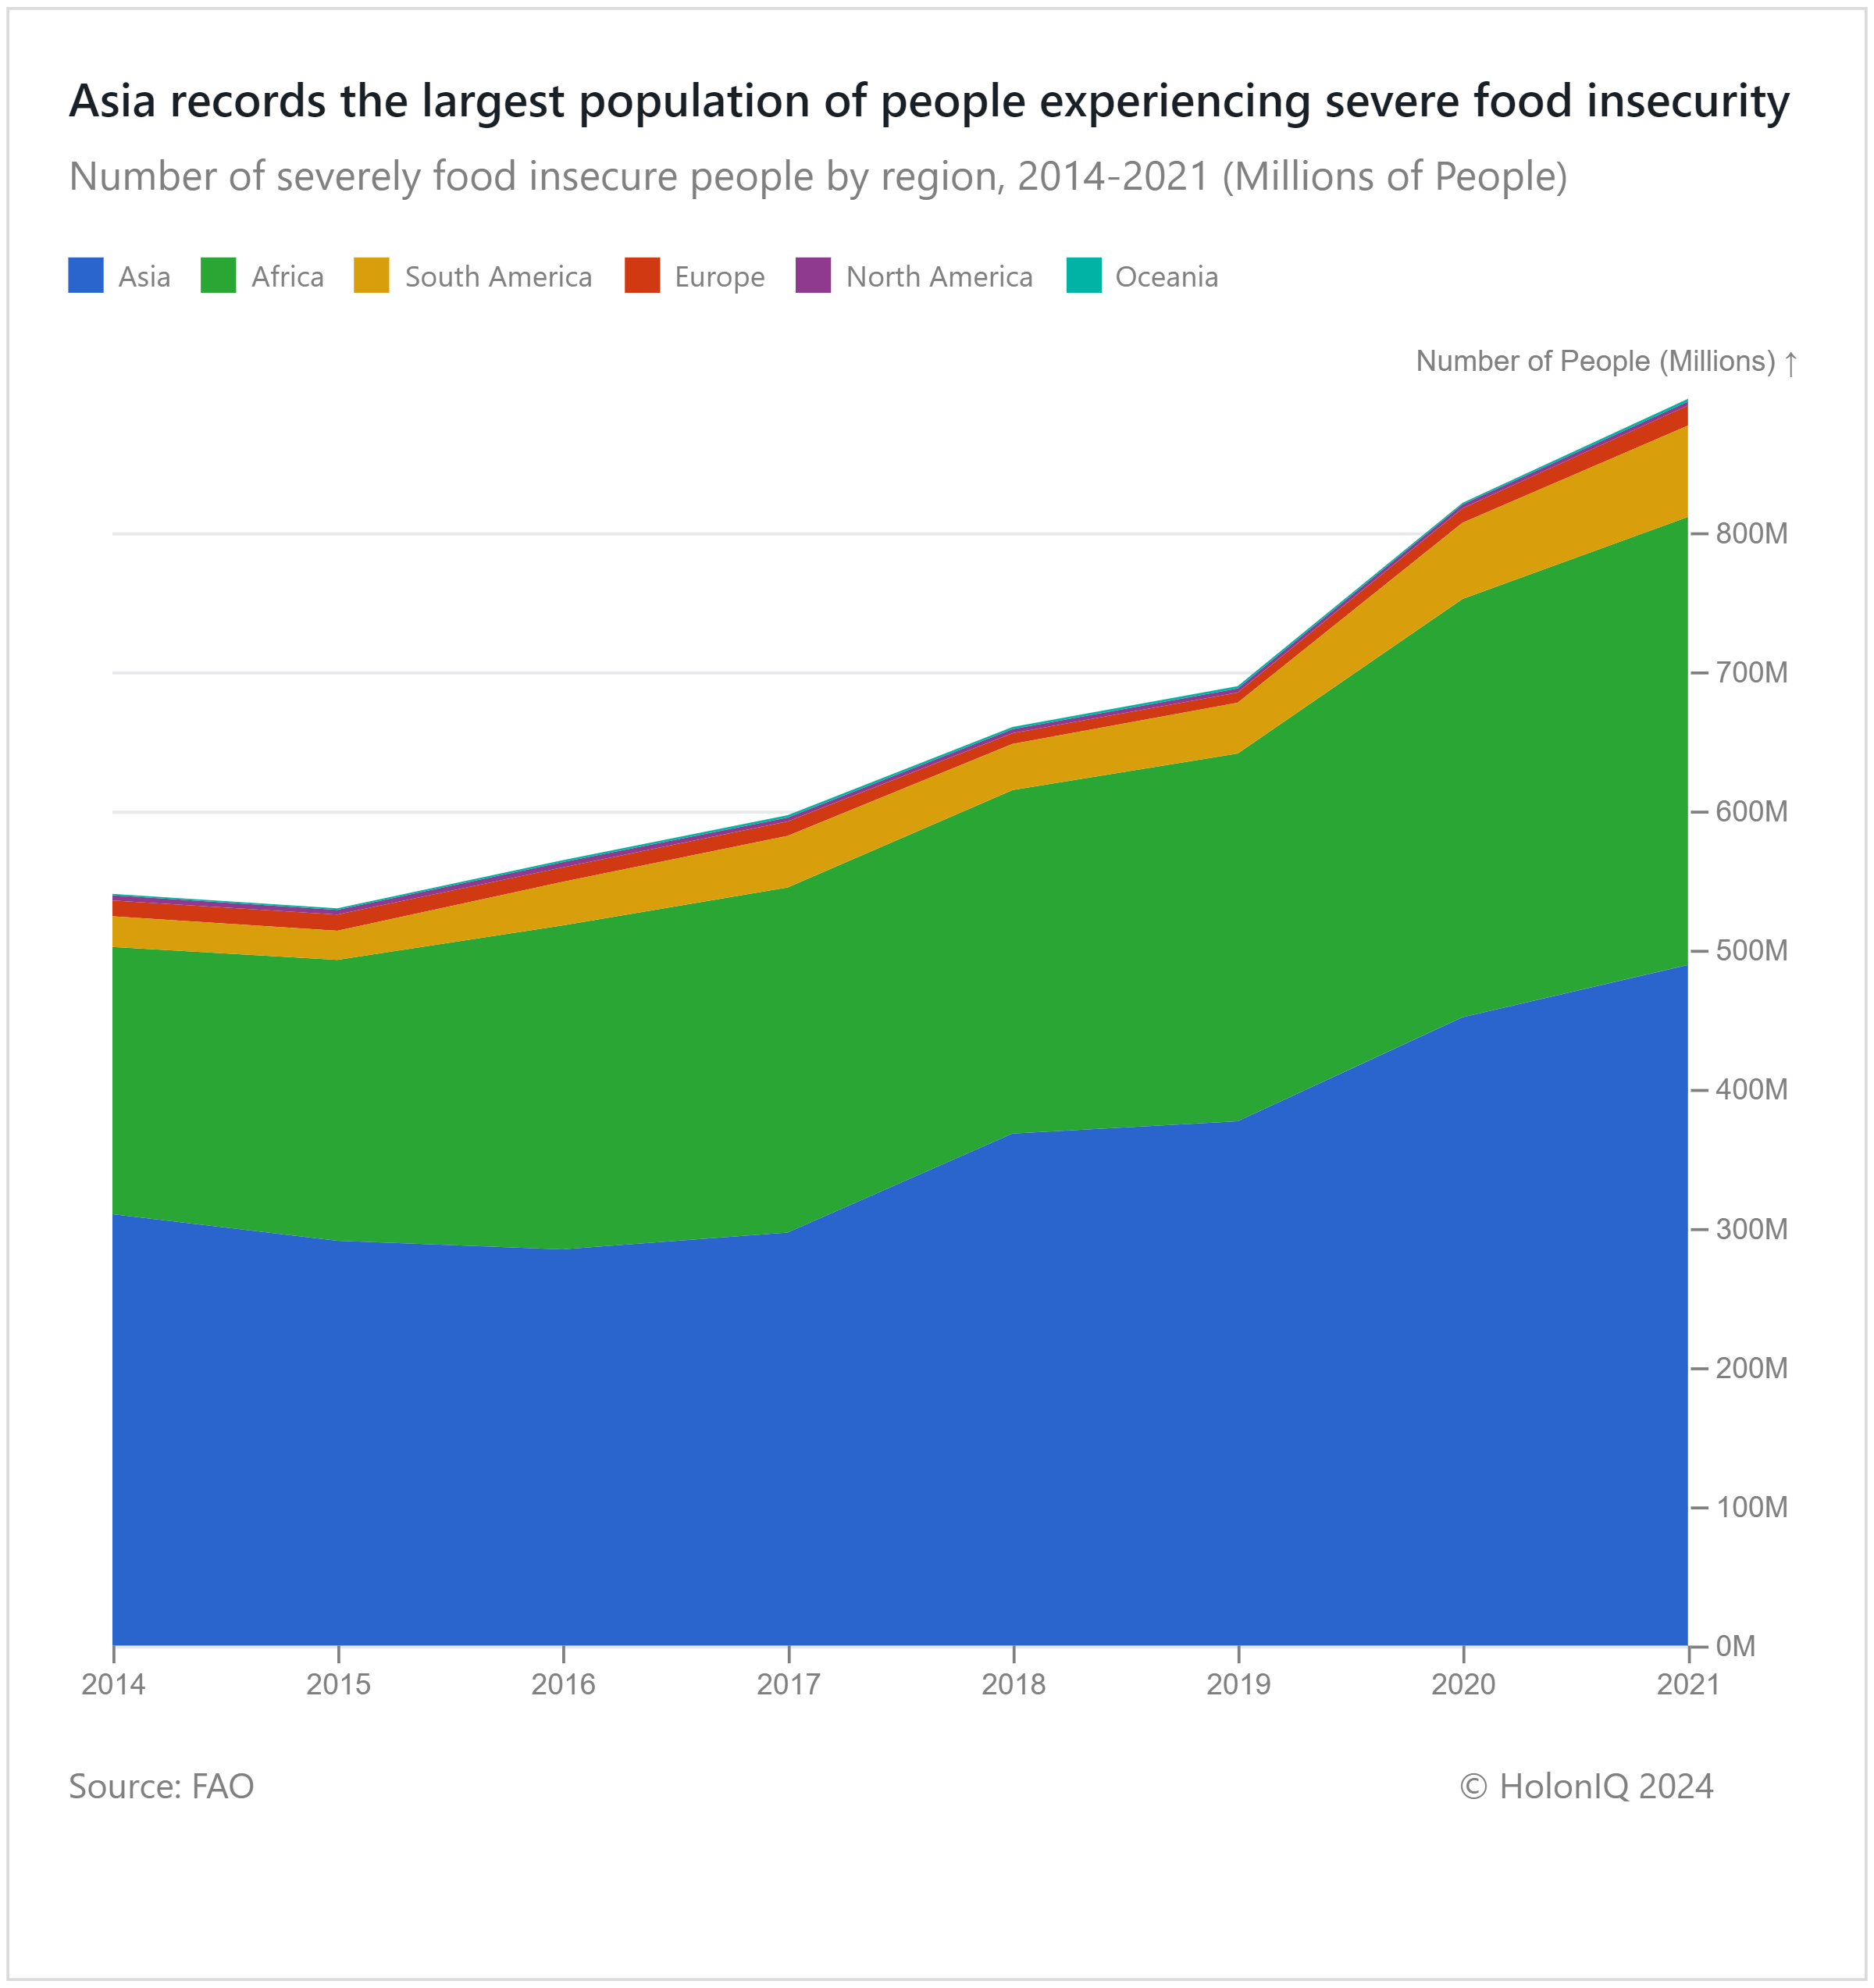
With a population exceeding 480 million food-insecure individuals, Asia has the highest number of people experiencing food insecurity. The high population density in certain parts of Asia strains land and water resources that are crucial for sustainable food production. 1.2 billion people also lack access to clean cooking facilities, nine times more than the number of people without electricity in developing Asia. Rapid urbanization exacerbates the issue. With agricultural land converted into residential and commercial spaces, the availability of land for farming reduces.
In Sub-Saharan Africa, the population facing food insecurity grew by 68% between 2014 and 2021. Food production in the region is unable to meet the rapidly growing population, with agricultural productivity deteriorating over the years. The region grapples with agricultural challenges, including poor soil quality, sub-standard seed, and water shortages, all of which are compounded by its vulnerability to climate change.
Like getting this newsletter? For unlimited access to over one million charts, request a demo.
Thank you for reading. Have a great week ahead!
Have some feedback or want to sponsor this newsletter? Let us know at hello@holoniq.com
